August 1, 2018
DOWNLOAD PERSPECTIVE
One can make a compelling narrative why the bull market in U.S. equities is not over. For starters, 2018 has ushered in the lowest statutory corporate tax rate since the 1940s. U.S. companies are on pace to repatriate $500 billion from abroad in 2018, with more dollars coming home in 2019. Earnings growth is well over 20% year-over-year, and plans to deploy this liquidity into the domestic markets are beginning to materialize. Unemployment is just 4.0%, and may very well trend lower.
However, there are cautionary signs worth noting. The Federal Reserve has now hiked interest rates seven times, and is telegraphing at least two more hikes in 2018. While credit spreads are not flashing warning signals, we are reminded of a quote by Rudi Dornbusch, an MIT Economist, who famously said “No postwar recovery has died of old age. They were all murdered by the Fed.” The yield curve has continued to flatten, as long-term rates remain captive to the massive buying power of global central banks.
Simultaneously, the Trump administration is seeking to alter the global trade and security framework whose foundations have been in place since the end of WWII. Rewriting this framework in any meaningful way would be a disruptive process with an unknowable outcome. For now, the U.S. equity market is giving the administration the benefit of the doubt, betting the tariffs and other threats lobbed at our trading partners are a negotiation tool, and the ultimate outcome will be positive for the U.S.
This tug of war between both bullish and bearish developments has led to muted returns in global equity markets so far in 2018. Lyell Wealth Management’s asset allocation decision to remain focused in the U.S. has been rewarded, as most international markets have struggled, especially in U.S. dollar terms. We do not foresee any dramatic asset allocation shifts in the near term.
U.S. Economy
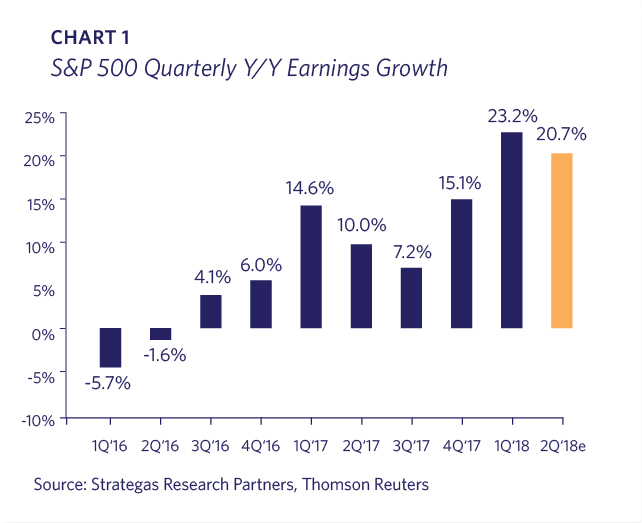
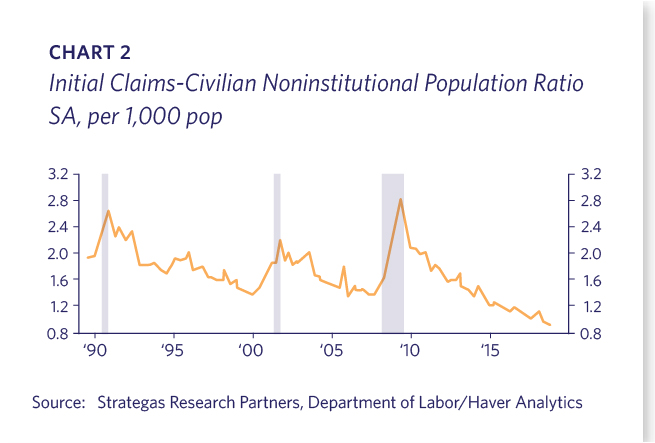
The U.S. economy is performing at its strongest levels in over a decade. Corporate earnings are exceeding high expectations. The December 2017 tax reform package, deregulation, and business investment incentives are notable factors accelerating growth. S&P earnings increased 23% year-over-year in Q1, and Q2 is expected to be nearly as strong (Chart 1). U.S. employment continues to thrive; workers filing jobless claims as a percentage of the population is significantly lower than at any time in the past 50 years (Chart 2).
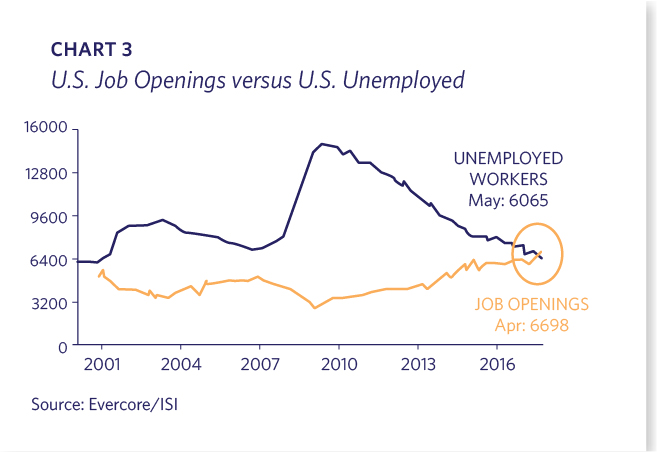
For the first time since this data was tracked, there are more job openings than there are unemployed workers (Chart 3). Government data shows the labor participation rate increasing, as some previously discouraged workers who had stopped seeking employment are re-entering the job market and finding jobs. The New York Times reported in June that applications for Social Security Disability benefits are plunging; the number of Americans applying for disability coverage last year was the smallest since 2002, and this year is running at an even lower rate. This change is so significant that the agency has revised its solvency projections and forecast a four year extension of program viability.
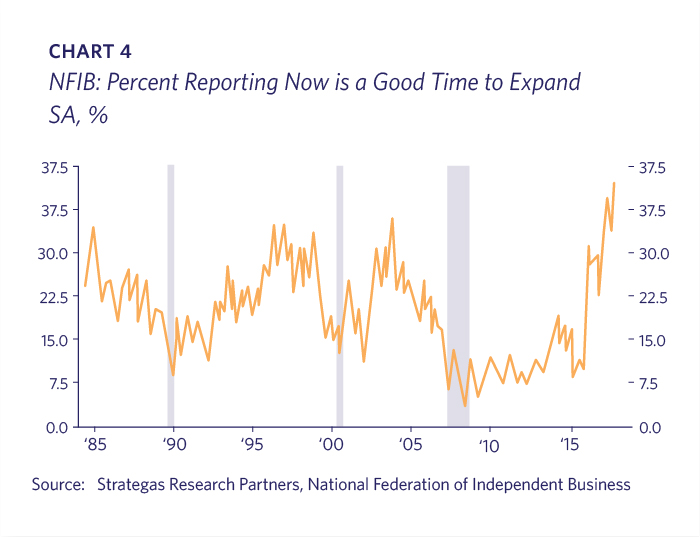
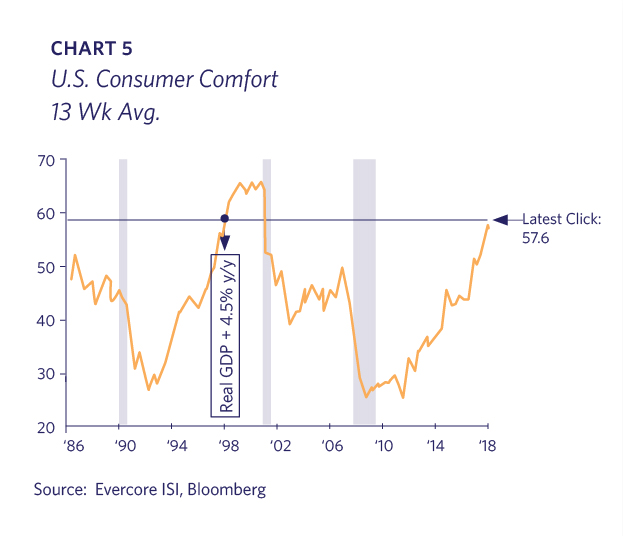
Small business confidence remains elevated at historically high levels, and the percentage reporting “now is a good time to expand” is at multi-decade highs (Chart 4). Consumer comfort is at an almost 20-year high and household debt payments as a percentage to total disposable income is at multi-decade lows (Charts 5 and 6). Restaurants, trucking companies and even retailers are at cycle highs.

Tax Cuts, Reform and Capital Spending
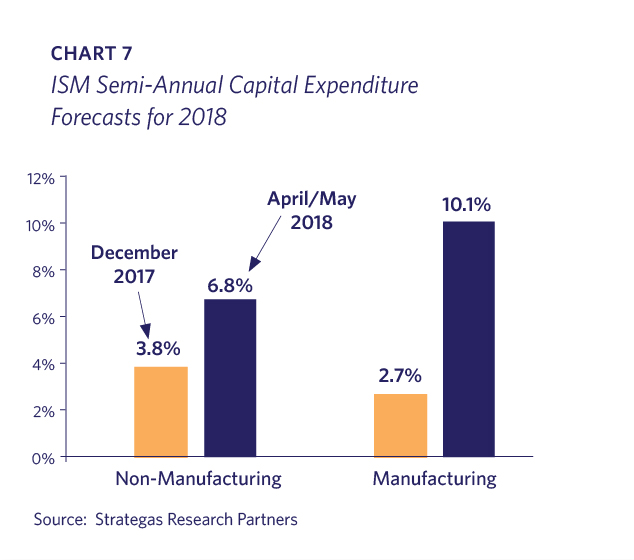
One key economic question is whether the tax package is a one-time benefit, or if it will spur a more lasting impact on growth. In addition to a lower corporate tax rate, the bill included 100% expensing for capital expenditures (“capex”) for the next five years. The early signs are promising as capex plans have already markedly improved, as indicated by the changes seen in the Institute of Supply Management’s survey data from December 2017 to April/May 2018 (Chart 7). Planning cycles often take 6-12 months, so expectations are that by the 2nd half of 2018 more capex will be underway. Increased capex would be a driver of continued strong growth, prolonging this economic cycle. We will be monitoring the incoming capex data closely in the coming months.
The tax bill removed many of the incentives for U.S. companies to invest offshore or keep cash earned overseas out of the U.S. There is much debate over whether this repatriated capital will be used in ways to increase U.S. productivity. Company surveys indicate that, while a majority of the funds will be used to pay down debt or repurchase shares, the third and fourth most popular plans are to boost M&A and to increase capital expenditures. One could anticipate that other major economies will lower their taxes to compete, potentially stimulating additional global growth.
Rest of the World
European growth has softened. The primary contributors to Europe’s recently stronger economy were transitory factors such as a weaker euro and lower oil prices. Europe’s lack of labor reform, a rebounding euro and higher energy prices have stalled this momentum. While growth in the region remains positive, it is far from inspiring. In our opinion, Europe continues to be a wonderful place to visit, but a disappointing place to invest.
China has been focused on reducing risks within its financial system while maintaining economic growth; its most recent policy moves, however, have been aimed at offsetting any growth headwinds generated by the tariff conflict with the U.S. Japan continues to show signs of revitalization by increasing legal immigration and improving corporate governance. Some emerging markets, such as Argentina and Turkey, have had financial crises partly as a result of the surging U.S. dollar. However, the developing countries’ problems don’t appear likely to ripple through the global financial system.
Trade Wars and Tariffs
U.S. politics are frenzied, hyper-partisan and volatile; this is as fragmented an environment as we can remember. The global framework is in the process of being renegotiated, and the primary negotiator’s style is unpredictable. Global trade has elevated the quality of living for billions of people worldwide. It has also provided U.S. consumers with goods at less expensive prices than otherwise obtainable by domestic manufacturers.
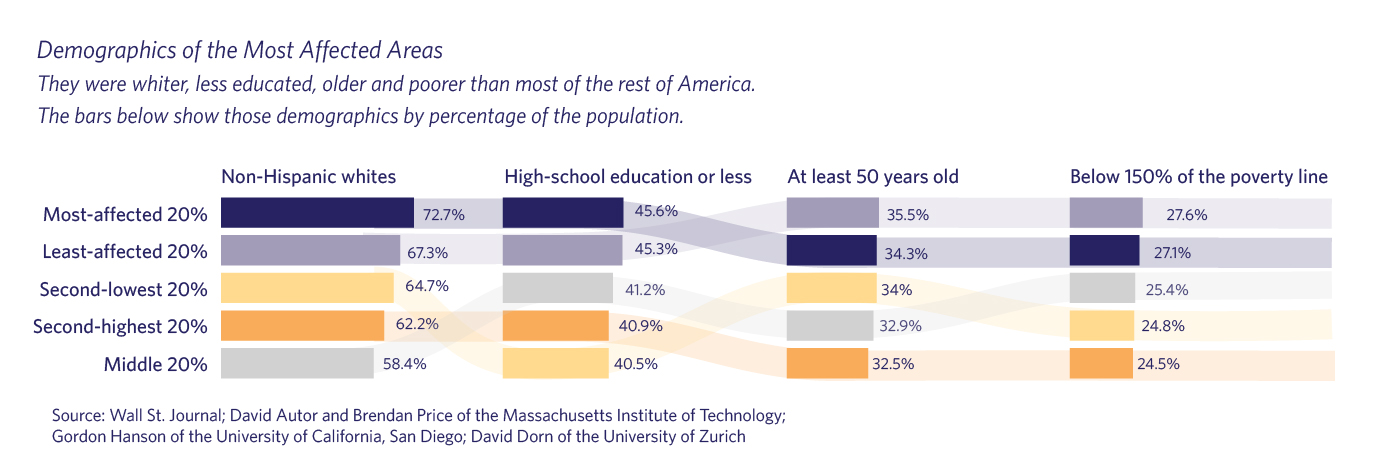
However, while globalization has clearly brought cheaper goods to consumers, the costs and benefits of free trade remain a contentious topic in economic policy, as many of the “adjustment costs” were not well accounted for in economic models. The website chinashock.info, a comprehensive database created by researchers from MIT, University of Zurich and UC San Diego, contains an interactive map of the U.S., overlaid with the most affected industries and the corresponding demographics of workers in those industries. While these impacted workers are able to buy cheaper televisions, clothes, toys and furniture, this has not adequately compensated for their diminishing employment prospects, loss of status, and inability to meaningfully participate in the economy (Chart 8). While one can argue whether the current administration – or any administration – can actually help this segment of the population, it is clear that Trump is tapping into this frustration with his trade demands.

The global trade framework was developed over many decades. Any changes to it will inevitably result in market volatility. A full-blown trade war with China would affect business confidence, supply-chains and growth. There is a growing consensus that the administration needs to resolve some of the trade issues sooner than later. As mentioned, business investment likely will be the primary driver of growth in 2019 so monitoring these data points is important. Reaching an agreement with the E.U. or NAFTA would be an important step to show progress, as the negotiations with China seem destined to take longer. Short of a populist led revolt on the world order, we do not foresee real meaningful change to this system, as the economic and political costs would be enormous.
Midterm Elections
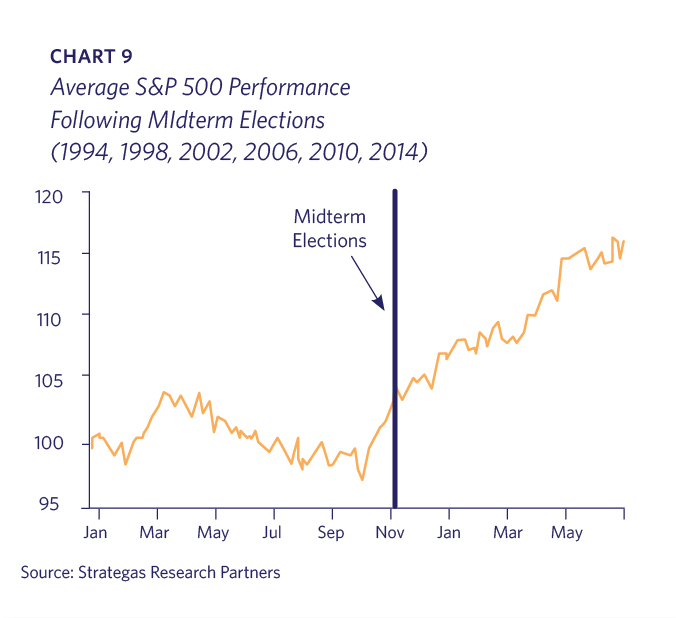
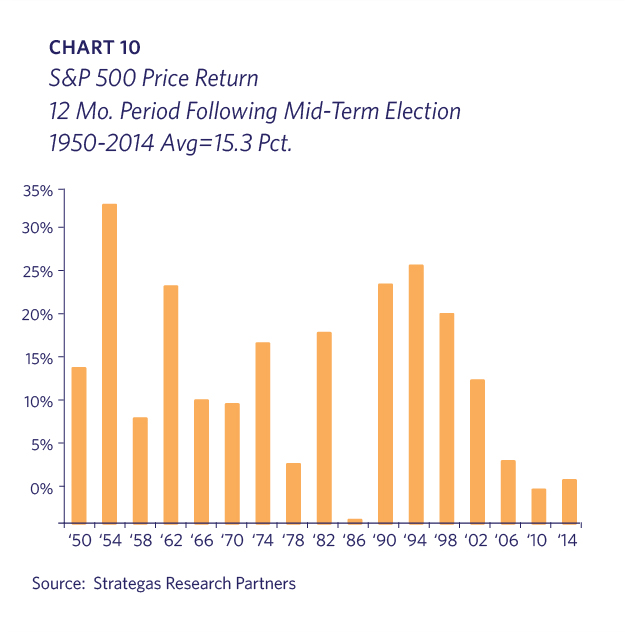
Midterm election years are notable for their market volatility and back-end loaded performance. The party out of office is usually more energized than the incumbent, and in a lower-turnout election, intensity translates into electoral wins. The uncertainty ahead of the elections typically results in a challenging stock market until close to the event and then a strong move up afterwards (Chart 9). Market corrections during mid-term election years are common, but historically they are buyable with prices higher one year later. The S&P 500 has not declined in the twelve months following a midterm election since 1946 with an average return of 15.3% (Chart 10).
It is important to separate the politics from the economics. While the potential trade war has large economic implications, chaotic American politics does not necessarily translate into poor stock markets. In 1968 when Martin Luther King, Jr. and RFK were assassinated and there was blood in the streets at the Chicago Democratic convention, the S&P increased 10%. During Bill Clinton’s impeachment trial in 1998 the S&P increased over 28%. Ultimately, while policy matters to markets, politics typically does not.
Stocks
The U.S. market indices have been in a trading range since peaking in early February. Tremendous corporate earnings have been blunted by the aforementioned policy uncertainty, rising interest rates, and the need to consolidate gains after a big run-up the prior year. It has been a divergent market with stronger performance by sectors typically more associated with growth such as Small Cap, Technology and Consumer Discretionary companies. U.S.-centric companies have performed better than global competitors with Industrials having suffered as a result of trade war fears, a strengthening U.S. dollar and relatively weaker growth in Europe. The flat stock market in the midst of rapidly growing earnings has resulted in P/E compression and lower valuations for most companies.
The fundamental strength in earnings is supported by an almost frantic M&A market. There is approximately $1 trillion in private equity dry powder available for transactions, and lenders eager to support them. No doubt numerous companies’ valuations are implicitly supported by an assumed potential takeout. The acquisition of Time Warner by AT&T is greenlighting more mega-mergers.
Further supporting the risk-seeking behavior of market participants, recent IPO indices are notching new cycle highs. It remains to be seen if this is the beginning of a new wave of IPOs, but the stock market’s receptivity to new issues is certainly getting the attention of companies considering selling their stock to the public.
Interest Rates and Bonds
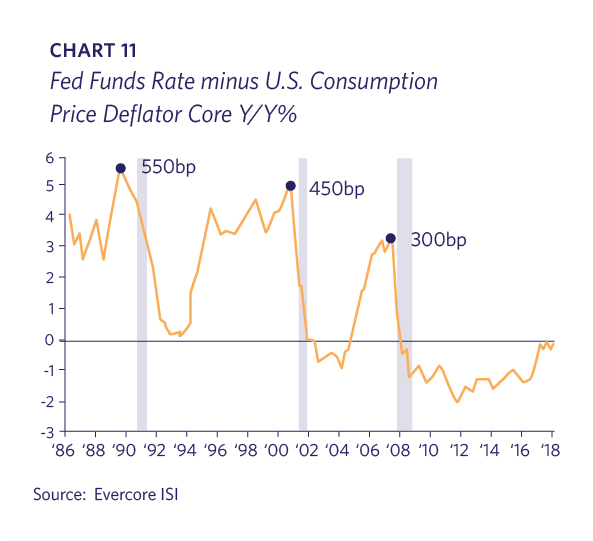
Despite the Federal Reserve having increased the overnight Federal Funds rates 7 times over the past 2 years, rates are still low. When viewed on a “real” or “inflation-adjusted” basis, the Fed Funds rate has finally reached 0%. History suggests that rates tighten at least a couple percentage points above the inflation rate before presaging a recession (Chart 11).
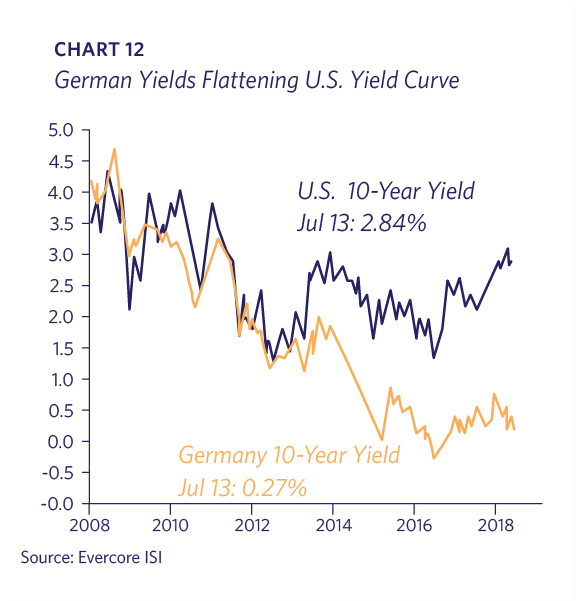
Long-term rates, which the Fed does not directly control, have not responded to the same degree. There is much debate over the reasons, but certainly one factor is that interest rates are very low overseas; institutional investors have the ability to arbitrage through currency swaps to maintain a relationship across markets. The larger European countries and Japan still have negative short-term rates and active central banks as purchasers of long-term bonds. This is keeping overseas bond yields barely positive. The spread between the U.S. and German 10 year bonds is over 2.5% (Chart 12). The net effect is a more economically stimulative U.S. market than if our market operated in isolation.
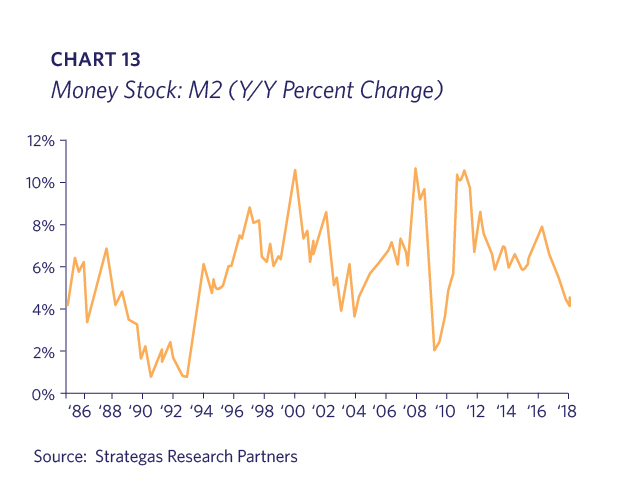
As the Federal Reserve continues to methodically raise short-term rates, the U.S. yield curve has flattened. Since a yield curve that inverts has historically always been a harbinger of future recession, this is getting plenty of attention. A flat yield curve is very different from an inverted one, however, as shown by the 1994-1998 period. That era saw a flat but still positive curve coupled with a strong economy and bull market. However, there is an old market saying “Don’t fight the Fed”, and we are mindful that we are in a tightening cycle. Liquidity has been a primary factor in this bull market. The money supply, as measured by M2, increased just 4% year over year in July, which is the slowest rate of change since 2010 (Chart 13).
Takeaways
It is August in a mid-term election year. History suggests that the stock market is due for a couple more months of middling to poor performance. It also suggests that an unpleasant drop is a reasonable possibility.
There is a case to be made that the combination of lower taxes and lesser regulation will usher in stronger growth in the upcoming years, making this the longest expansion in U.S. history. In this scenario, the bull market in stocks will continue to make new highs. However, the enormity and difficulty of renegotiating major trade relationships should not be trivialized nor should the challenges created by a Federal Reserve that is draining liquidity after a decade of abnormal monetary policy. Given the many offsetting factors present, and the challenge in predicting how any one of these scenarios will unfold, Lyell Wealth Management’s outlook is more balanced than it has been previously. Our focus is on ensuring that each client’s asset allocation has sufficient diversification and liquidity in the event that the bull market ends abruptly, while also maintaining equity exposure in the case of continued gains.