June 15, 2017
DOWNLOAD PERSPECTIVE
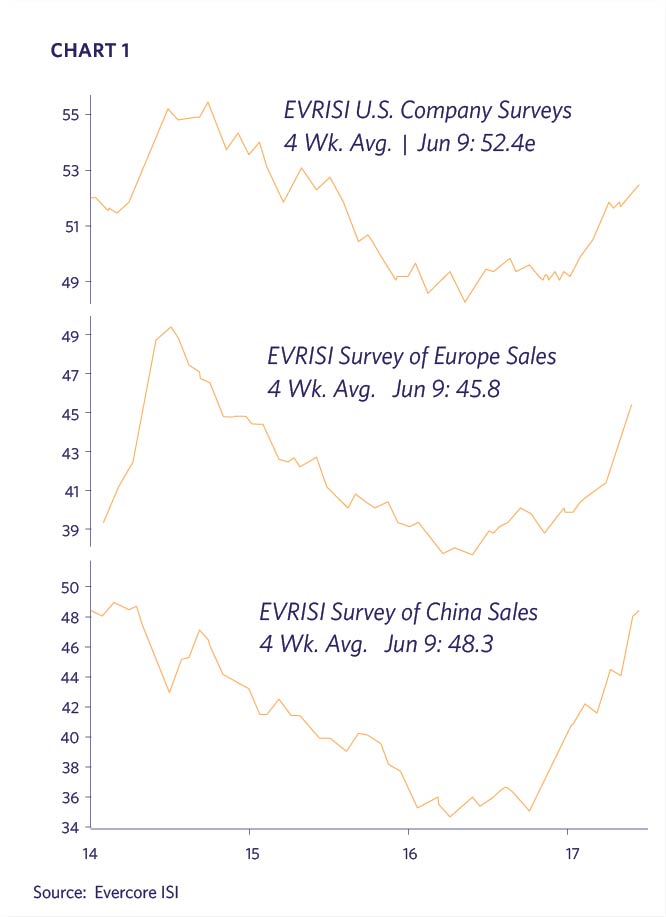
The global economy continues to exhibit improved growth through the first half of the year. Although no region is booming, the major economies in Europe, Japan, and China are performing better than in recent years, while the U.S. maintains a steady pace. Evercore ISI has conducted a weekly broad-based corporate survey since 1993 to monitor shifts in economic activity. Its June 9, 2017 survey of company sales illustrates the synchronized improvement and uptrends in the U.S., Europe, and China (Chart 1).
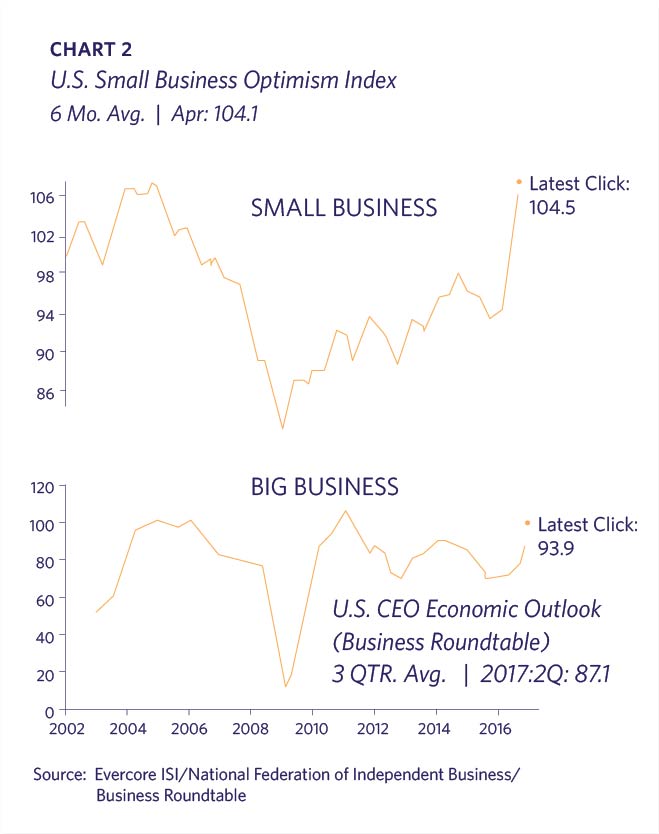
Although the U.S. delivered another disappointing GDP print in Q1, data for Q2 is much improved. The global upswing commenced prior to November’s U.S. elections, but there was a pronounced spike in U.S. Small Business Optimism after President Trump was elected. Presumably the promise of less regulation and lower taxes bolstered confidence. Surprisingly, despite political turmoil and little legislative accomplishment to date, confidence has stayed elevated. Big business is also optimistic, although its confidence is likely explained more by the better economic growth (Chart 2).
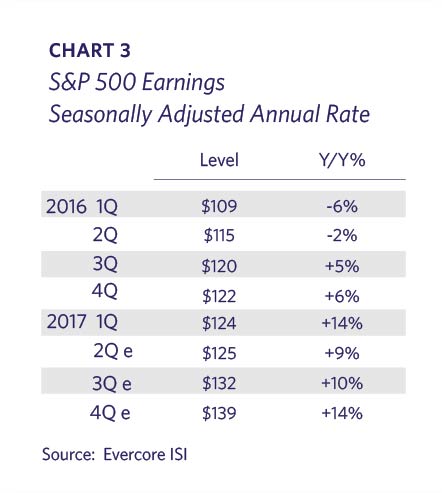
The improved economic environment has coincided with an expectation of better corporate earnings. The U.S. endured an “earnings recession” over the six quarters preceding Q3 2016 as a result of the plummet in energy prices and a stronger dollar. Earnings are clearly on the mend and have been a major factor in stock prices moving to all-time highs. S&P 500 earnings enjoyed the best quarterly growth in Q1 2017 in nearly six years by expanding by over 14%. U.S. corporate earnings are currently projected to end 2017 at a seasonally-adjusted annual rate of $139; this rebound provides further fundamental data to explain the higher stock prices (Chart 3).
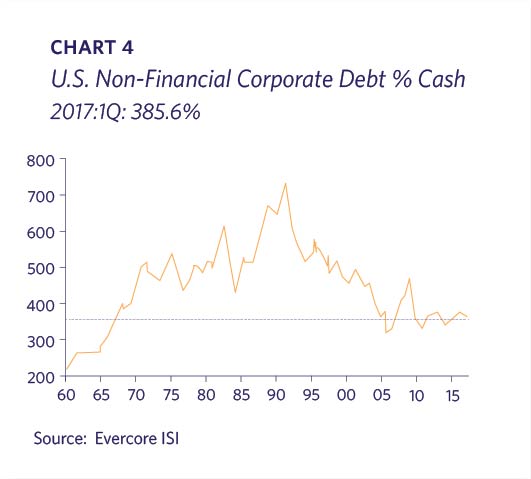
U.S. non-financial companies in aggregate have maintained more cash relative to debt in recent years versus prior decades. One needs to go back to the 1960s to see notably lower debt levels (Chart 4). This suggests that significant debt capacity exists in the event corporations were to borrow to fund capital expenditures or new initiatives.
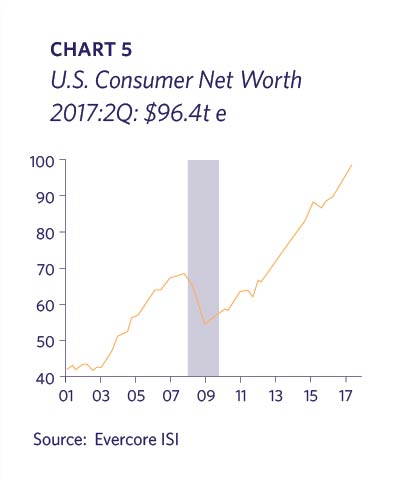
The corporate landscape has nothing on the U.S. consumer. Thanks to the booming stock market and fully recovered residential real estate, U.S. consumer net worth is at an all-time peak of $96 trillion (Chart 5).
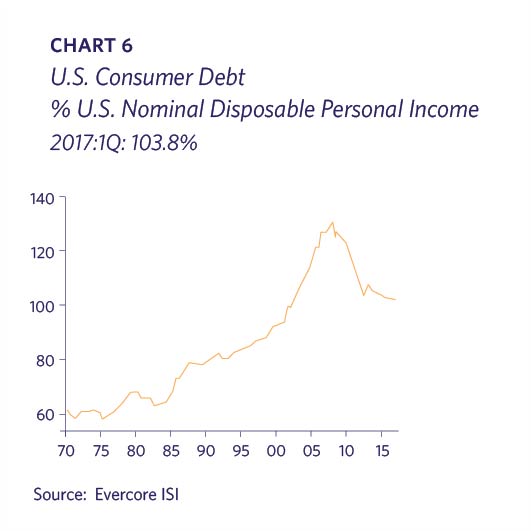
Consumers have continued to collectively deleverage with substantial improvement in terms of debt as a percentage of disposable personal income (Chart 6).
There are signs of emerging financial stress, notably in the car loan market and the over $1 trillion in accumulated student loan debt. However, it is interesting to note that there has been substantial progress made for those with the lowest FICO credit scores (Chart 7).
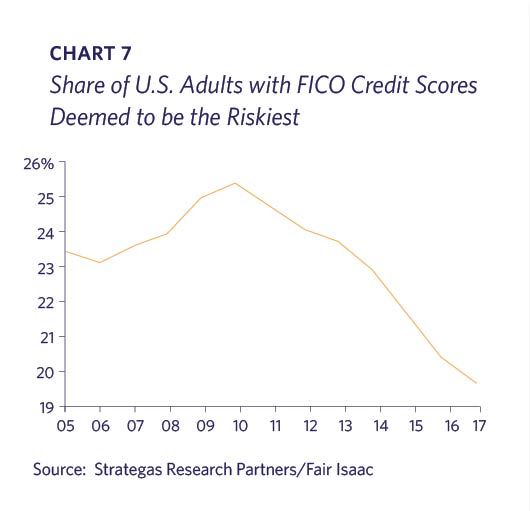
In addition, this autumn the company that compiles the FICO scores, Fair Isaac, will be removing tax liens and civil-judgment data from their calculations thereby improving the credit scores of approximately 12 million Americans per the Wall Street Journal.
Although debt levels in Chart 6 still appear elevated from a historic perspective, a different picture emerges when one looks at the household financial obligation ratio which is the percentage of disposable income dedicated to debt payments (Chart 8).
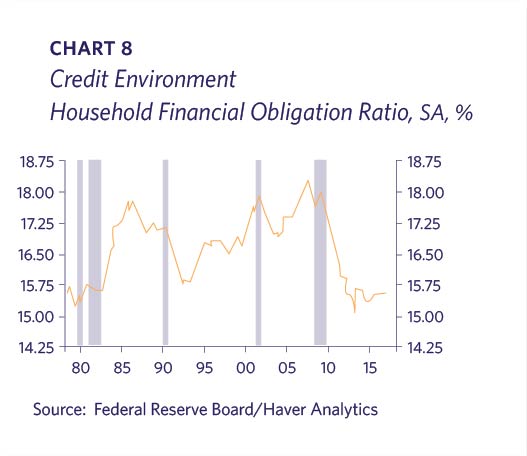
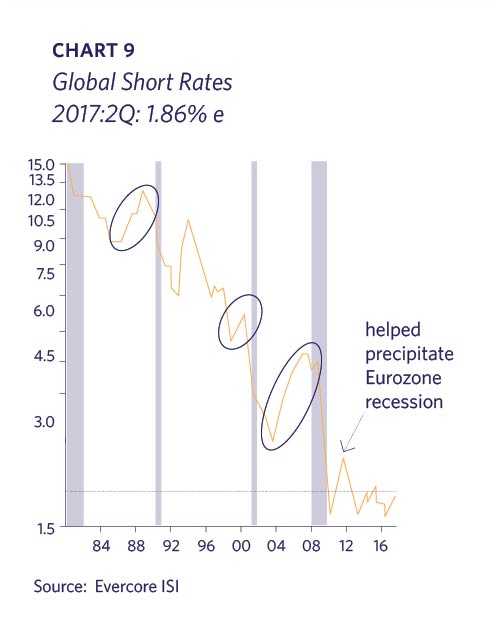
This improved affordability is directly tied to low interest rates enabling consumers to maintain or take on debt. Global central banks responded to the Financial Crisis with a variety of strategies to resuscitate the world’s developed and emerging economies. The Keynesian belief is that when economic recessions or depressions emerge, monetary policy should lower interest rates to below the inflation rate to alleviate the stress on borrowers. Interest rates remain at historically low levels despite the fact that the emergency has long passed. Global short-term interest rates are still near their abnormally low 2009 levels (Chart 9).
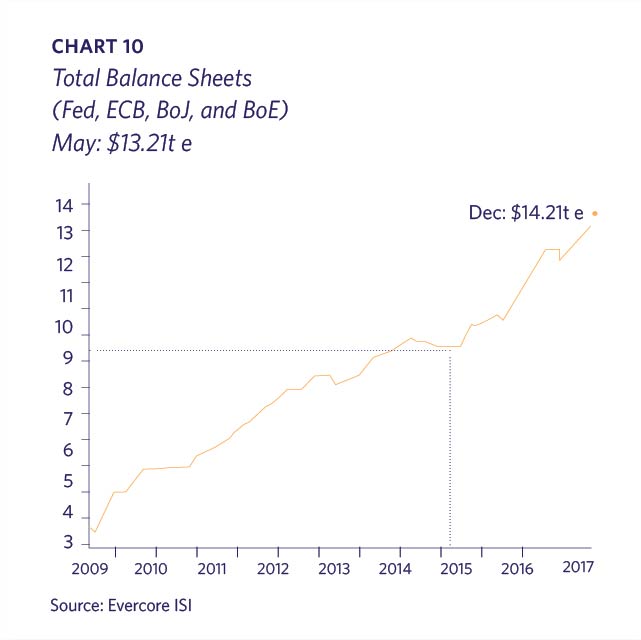
Although holding interest rates below the inflation rate during an economic expansion is highly unusual, even more unconventional is the central banks “quantitative easing” by which they will have amassed over $14 trillion on their balance sheets by year-end 2017; note this massive figure excludes China’s multi-trillion dollar holdings (Chart 10).
By buying long maturity bonds, the central banks reduce the supply of bonds available to price-insensitive investors who must buy long duration assets, such as pension funds and insurance companies. This depresses the level of interest rates. This low interest rate policy enables debtors to borrow more cheaply as well as refinance or manage their existing debt more easily.
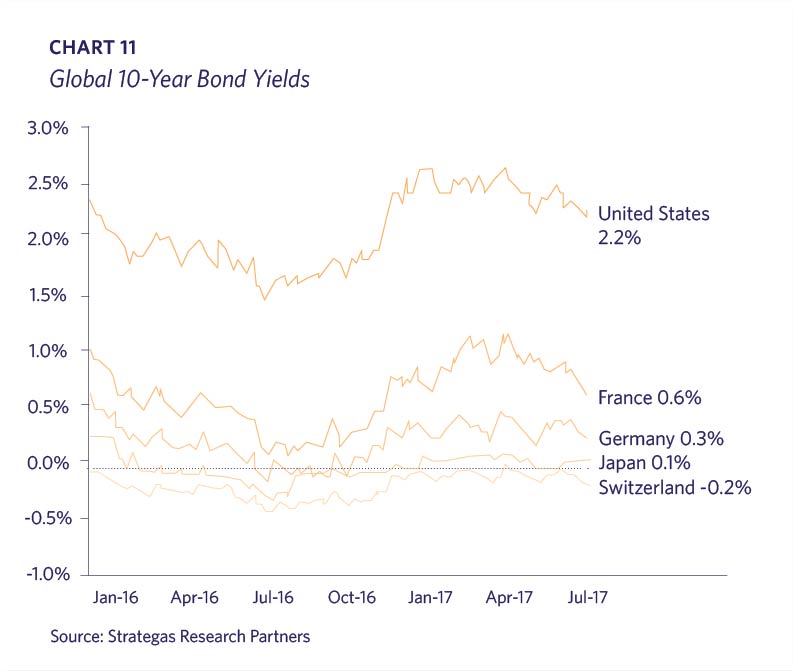
Due to global capital flows, U.S. interest rates and the US$ are highly influenced by other central bank policies. Although the Federal Reserve has stopped its quantitative easing, the European Central Bank, Bank of Japan and Bank of England continue to purchase bonds. It is not surprising that U.S. rates hew very closely to the other highly rated sovereign issuers once currency translation is factored in. It is highly likely that long term U.S. interest rates would be higher, if the other central banks abandoned their bond purchases (Chart 11).
The S&P 500 has increased by over 8% through the first five months of 2017 due to stronger economic growth, improved earnings and ample liquidity. By most measures U.S. stocks, along with the other developed markets, look poised for further gains ahead. Bull markets traditionally end when recessions occur, and a recession does not appear imminent.
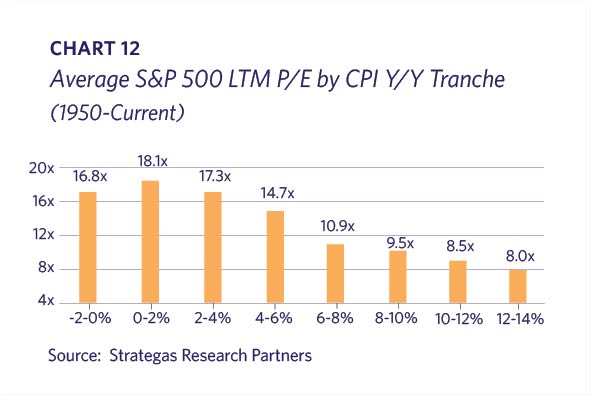
Despite the stock market hitting all-time highs, valuations continue to be reasonable in context of the interest rate and liquidity environment. The forward price/earnings (P/E) ratio is 17.7x which is within a normal historic range. P/E multiples have historically been highest when inflation is in the 0-2% range, which is where we are currently, and they don’t compress much until inflation exceeds 4% (Chart 12).
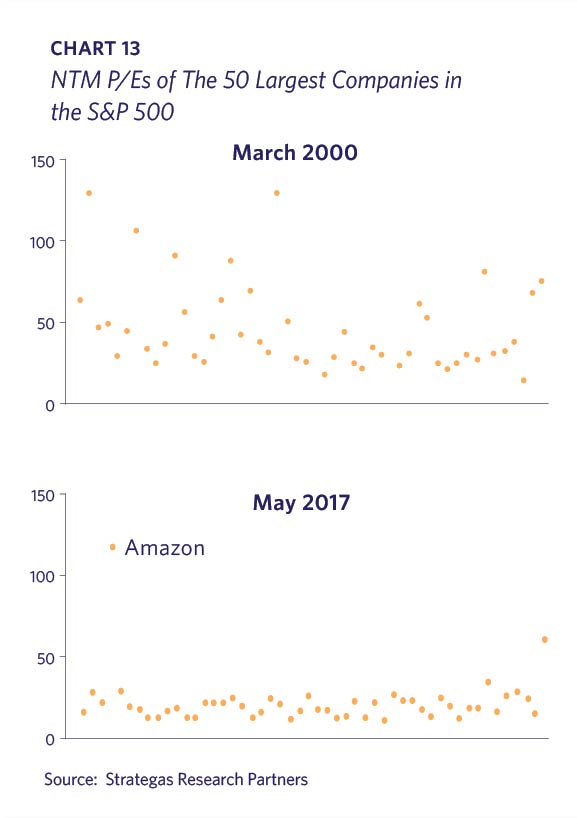
When stock valuations are viewed in the context of the dot.com bubble of 2000, the difference is stark. The scattergram in Chart 13 compares the 50 largest companies in the S&P 500 by P/E ratio in March 2000 and May 2017. The eyeball test indicates a very different environment with much more reasonable valuations today (Chart 13).
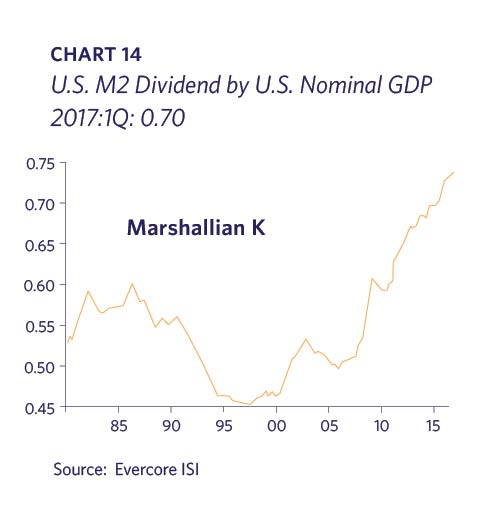
Lyell Wealth’s investment committee regularly reminds itself that this is not a normal economic expansion or market environment. Whereas we and most investors habitually focus on economic and corporate fundamentals, we have learned that liquidity can trump both. Due to the unprecedented aggressiveness of central bank policy in negative real interest rates and quantitative easing, the global markets have been flooded with liquidity. Every asset class has been inflated to various extents by the abnormally low rates. The Marshallian K is a ratio that compares M2 (typically regarded as U.S. money supply) to GDP; this theory hypothesizes that if money growth exceeds economic growth, then the money has to go somewhere (stocks, real estate, gold, art…). The chart below illustrates that money-supply growth has significantly outpaced economic growth since the Financial Crisis. This is likely sowing the seeds of another financial bubble (Chart 14).
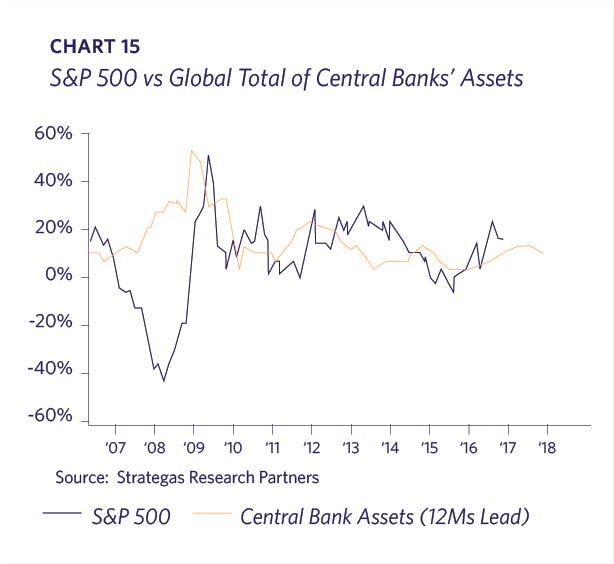
Perhaps it is no coincidence that the U.S. stock market in recent years has reacted to the amount of assets on the central banks’ balance sheets (a good proxy for global liquidity) with a one year lag (Chart 15).
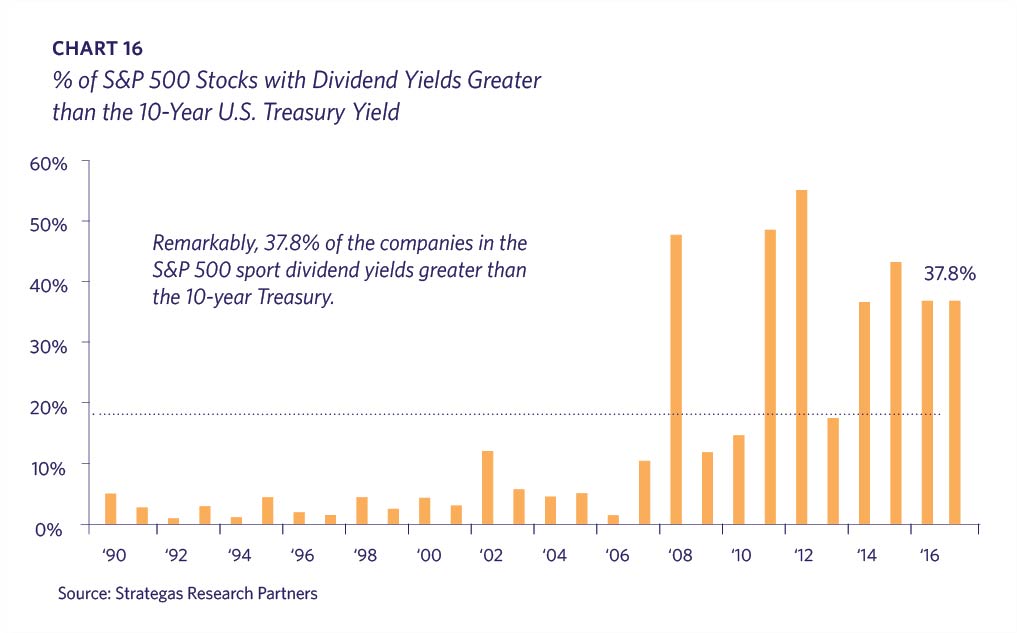
In addition to the favorable liquidity environment, suppressed interest rates lower the bar for other investments on a comparable basis. Almost 38% of the S&P 500 stocks sport dividend yields higher than the 10-year Treasury note; the large numbers of such companies is far higher than the two decades prior to the Financial Crisis (Chart 16). It is also worth noting that stock buybacks are more commonly used today than in prior decades, which means that shareholder returns are understated versus history.
Lyell Wealth continues to view the economic and market environment as positive for risk assets, such as stocks and real estate. However, we suspect that the next serious market downturn will likely be prompted by liquidity being withdrawn from the markets. For now, in addition to better fundamentals, the central banks continue to buy more bonds to add to their massive warchests. Global liquidity is still ample, and we expect risk assets to continue to appreciate as long as that remains the case.