March 20, 2017
DOWNLOAD PERSPECTIVE
Lyell dedicates significant resources to pay for top-notch proprietary research. This access helps Lyell decipher real economic and market data and trends versus the sensational-seeking “news” disseminated by the media. We intend to periodically publish a Snapshots issue that compiles charts, tables and graphs that have recently caught Lyell’s attention. There may not necessarily be a common thread tying them all together, but they provide valuable insight into the factors which Lyell incorporates into its investment process.
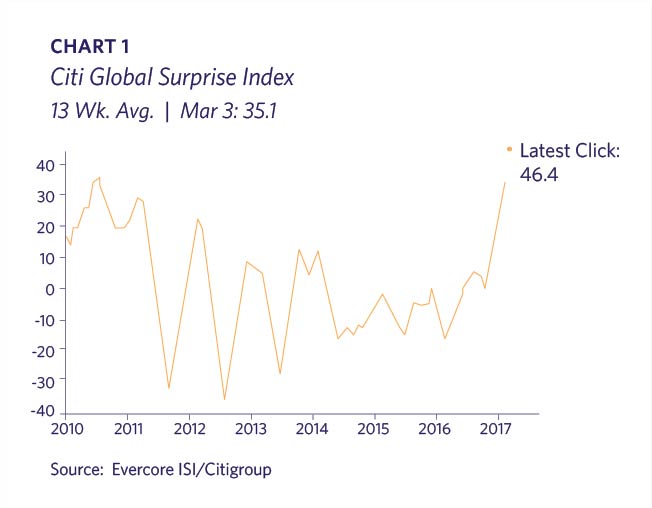
The global economy is enjoying a rebound. The spike is notable and broad based from the U.S., Europe, China and even Japan as reflected by Citigroup’s Economic Surprise index (Chart 1).
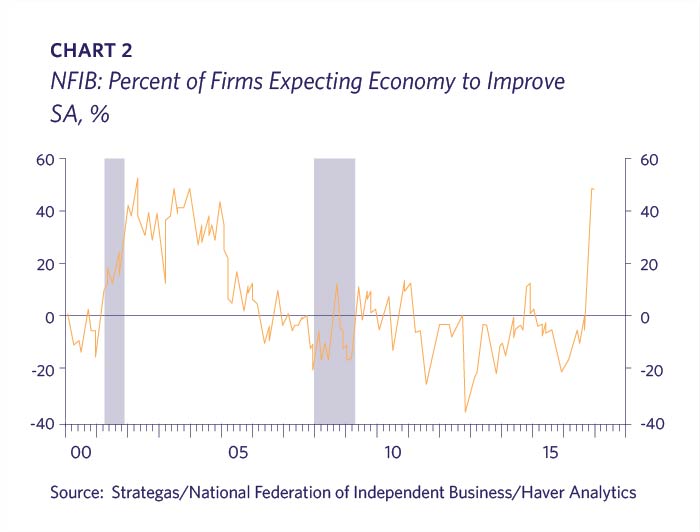
Small businesses in the U.S. are certainly more enthusiastic. The broad-based National Federation of Independent Businesses (NFIB) survey has jumped since the November elections. Small businesses have cited regulations as a major concern; a looser regulatory and credit environment is likely contributing to this optimism (Chart 2).
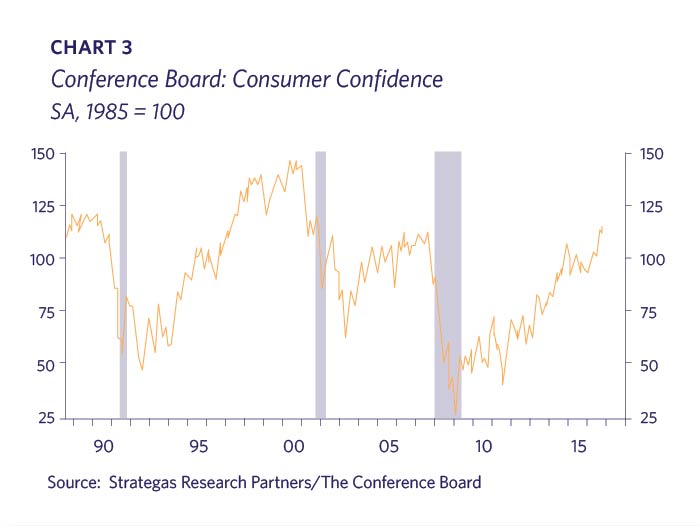
American consumers are likewise feeling more confident. The U.S. consumer has steadily gained confidence since the Financial Crisis as the employment picture has improved along with rising real estate and stock prices (Chart 3).
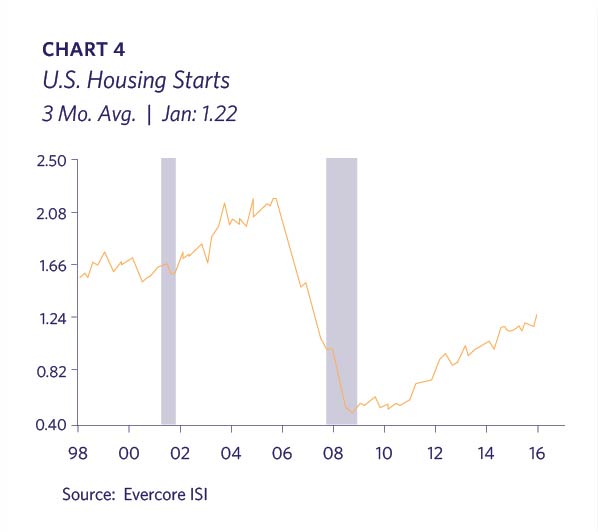
Housing starts are also increasing, albeit at a level seemingly inadequate to population size and household formation. Lyell continues to see substantial growth ahead in the national housing construction market due to demographic needs (Chart 4).
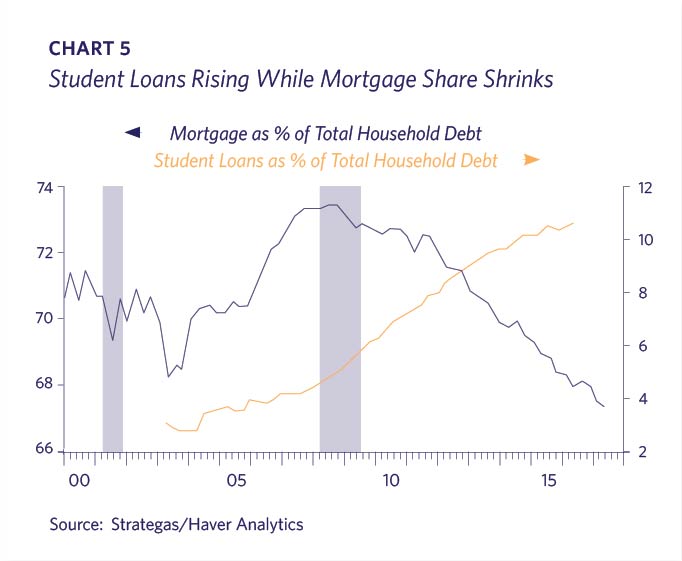
Substantial evidence indicates that land and labor scarcity, land use, and high permitting fees are somewhat restraining new construction. Another factor is likely the escalation of student debt outstanding, which has tripled as a percentage of total household debt in the past 15 years. This is a headwind toward home purchases and increasingly a political issue (Chart 5).
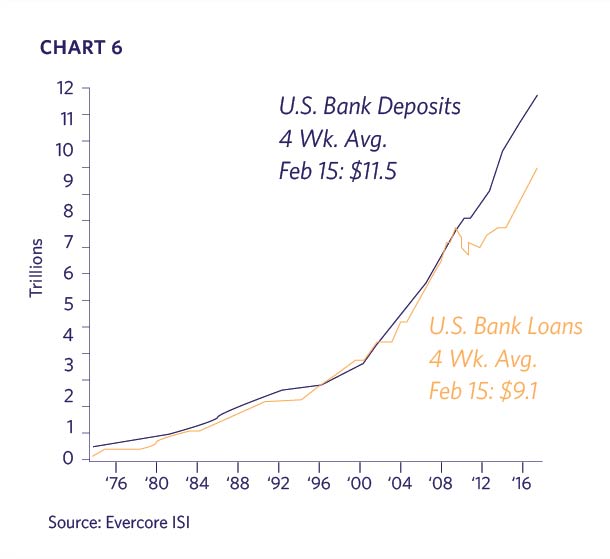
U.S. bank loans and deposits have historically had a tight relationship. Deposits provide the foundation to fund loans. There has been a decoupling since 2008. U.S. banks now have $2 trillion more in deposits than loans outstanding. Perhaps this is nothing more than post-Crisis financial institutions seeking more dependable deposits versus institutional hot money (i.e. Goldman Sachs has a bank taking retail deposits) and higher regulatory bank capital requirements due to Dodd-Frank. However, we wonder if this gap represents kindling for a significant escalation in banking lending? If animal spirits return in an environment of weaker bank regulation and credit standards, there is considerable fuel available (Chart 6).
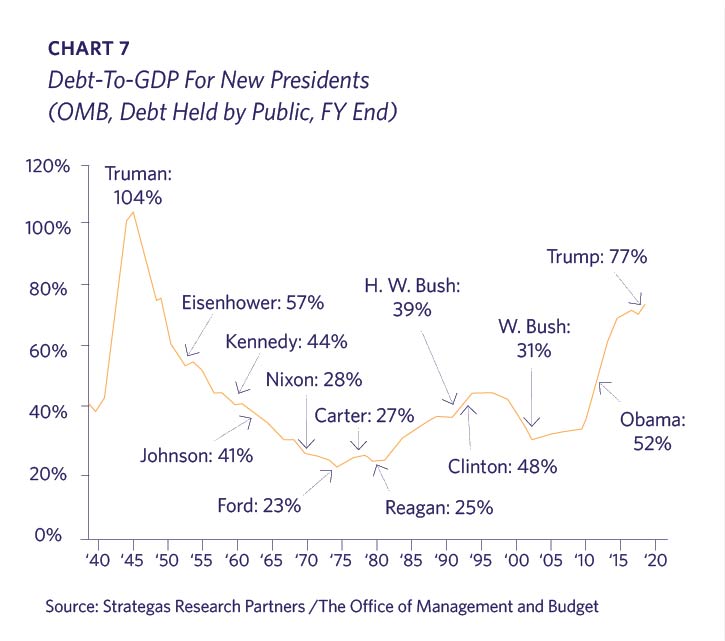
President Trump has voiced support for larger infrastructure spending and fiscal stimulus. His populist rhetoric faces ideological opposition from some Republicans. The sizable debt will likely restrain some “unpaid for” spending plans, as he inherits the largest debt-to-GDP ratio of any new President since Truman. The deficit will be a major political issue again as interest expenses become a larger share of the federal budget (Chart 7).
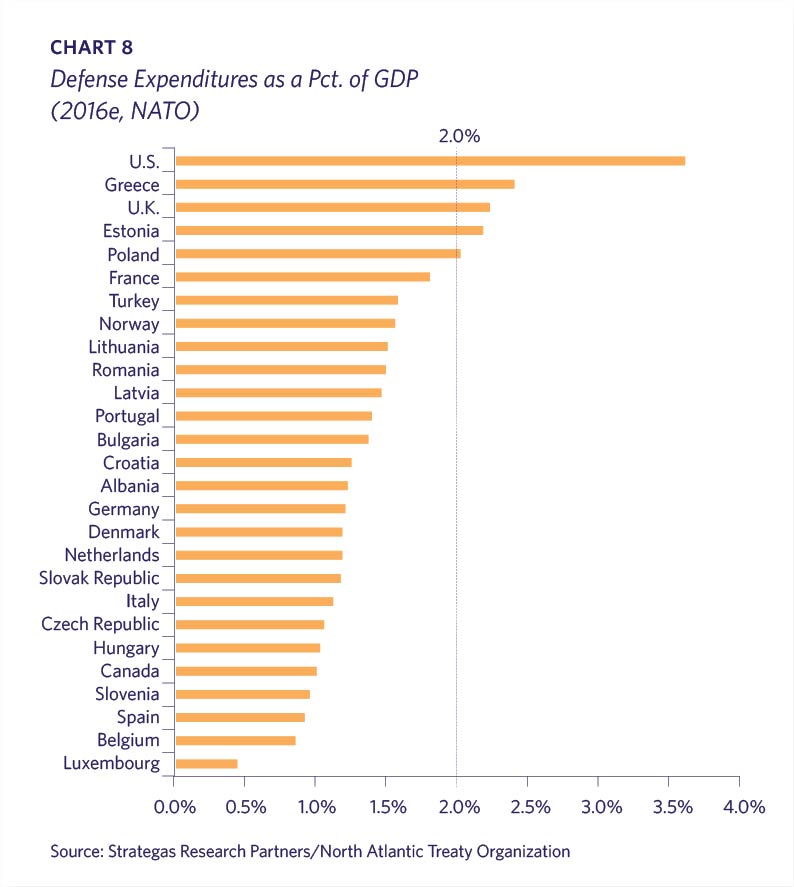
The new president has also emphasized increased military spending. Defense looks like an unfortunate growth industry. Much of the Middle East and North Africa are in chaos. China is expanding its military to match its economic power. This militarization is alarming its neighbors, including Vietnam, Indonesia and the Philippines. Japan is softening its post WWII Constitution restrictions in reaction. Europe, which has been shielded by NATO for its defense needs, will need to catch up. NATO obligates each country to dedicate a minimum of 2% of its GDP to defense expenditures, of which only five countries were in compliance for 2016. We can’t imagine President Trump not demanding increased financial commitment from U.S. allies (Chart 8).
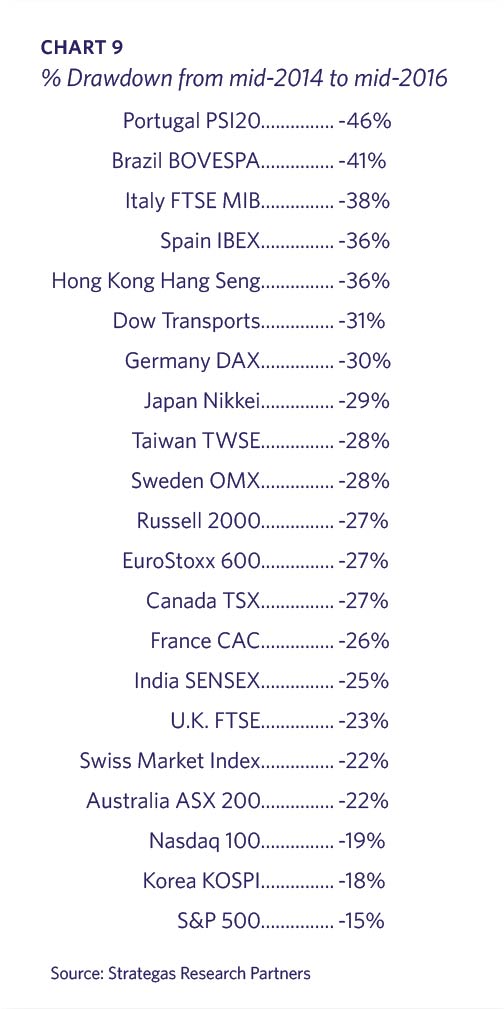
Pundits and media reports cite the longevity of the current bull market as evidence of an imminent end. Lyell has maintained that the global economy went through a re-set in mid-2014 when the US$ surged and oil prices collapsed. The definition of a 20% decline representing a “bear market” is arbitrary. It is worth noting again that almost 70% of U.S. stocks did indeed decline by over 20% during the period from August 2014 to December 2015. Many markets and indices experienced similar or even greater drawdowns (Chart 9).
Secular bull markets rarely end in apathy. This market has climbed the “wall of worry” since inception. Even today, after the recent increase in prices, individual investors remain surprisingly subdued as evidenced by the American Association of Individual Investors (AAII) survey. AAII has conducted this survey for 30 years, and early March marked a record 113 consecutive weeks where bulls have failed to take the majority (Chart 10).
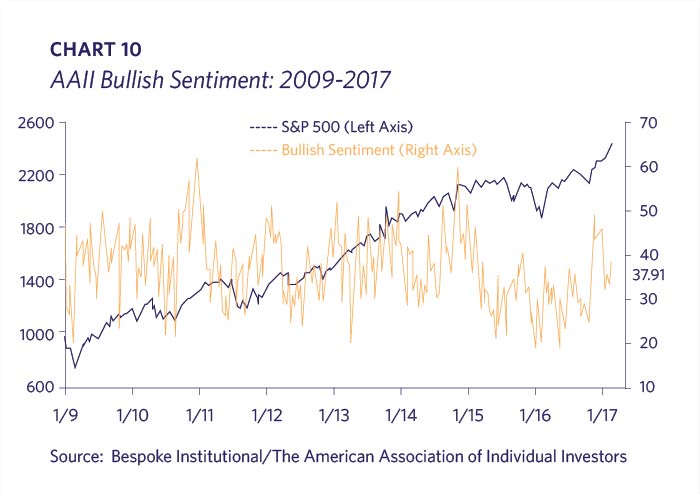
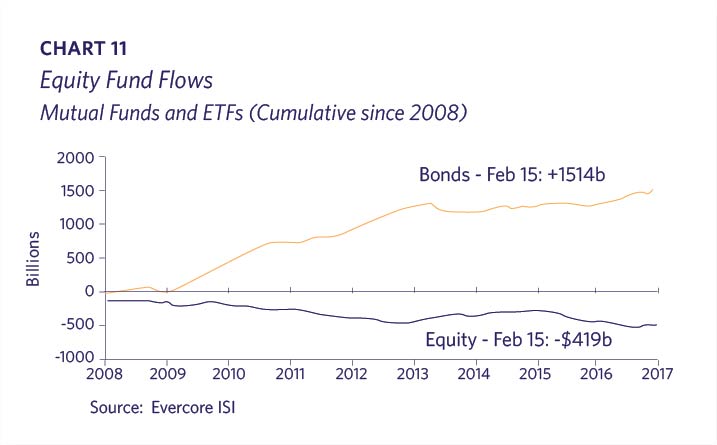
The sentiment captured by the AAII in Chart 10 is borne out in money flows. There has been over $1.5 trillion invested in bond funds and ETFs since 2008 versus a decline of $500 billion to stock funds and ETFs. This $2 trillion net difference is despite historically low interest rates. Negative returns on bond funds and rising stock markets has not yet resulted in a rotation to stocks (Chart 11).
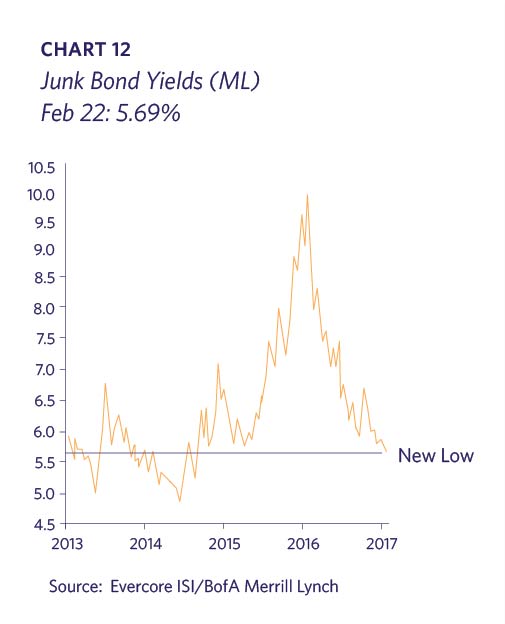
Credit markets often show weakness prior to significant stock market declines. The high yield or junk bond market in particular is likely to show deterioration when the economy is weakening or market liquidity is evaporating. At a minimum, today’s very low “high yields” are confirming the stock market’s strength (Chart 12).
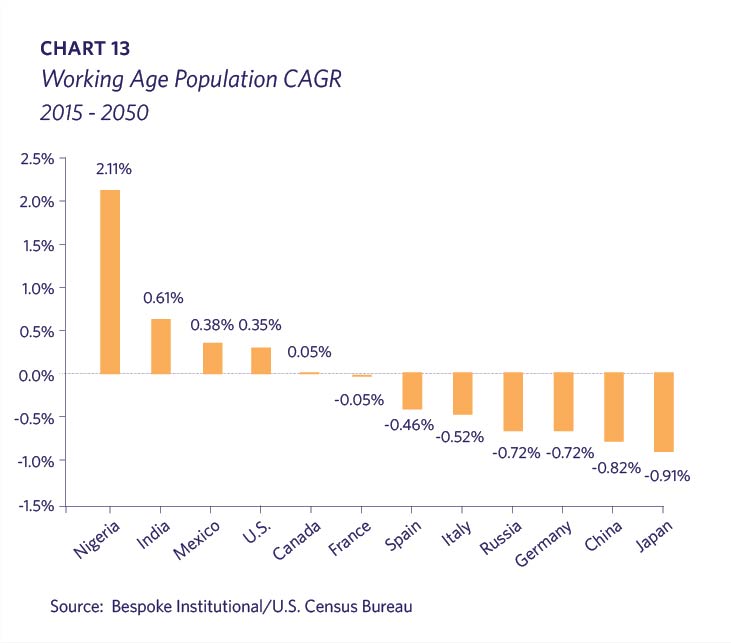
Economic growth as measured by GDP has only two components: productivity multiplied by population growth. A factor frequently used to explain the U.S. weak economic growth since the last recession has been slower population growth. Lyell thought that the U.S. Census’ projected global growth for a range of countries is noteworthy as most of the world’s major economies are likely to see negative contribution from their working age population over the next several decades (Chart 13).
Summary
The above information is incorporated into Lyell Wealth Management’s investment strategy and asset allocation. We continue to favor risk assets over fixed income due to relative valuations, but only to the extent appropriate for a particular client’s objectives and needs. Most of our clients’ equity positions are in companies that benefit in a growing economy, including investments in the defense, banking and housing sectors. We are mindful, however, that the secular backdrop of high debt levels, lower population growth and political stress make the present time different than prior periods. We remain focused on achieving the right balance of growth and capital preservation for each client.