September 30, 2017
DOWNLOAD PERSPECTIVE
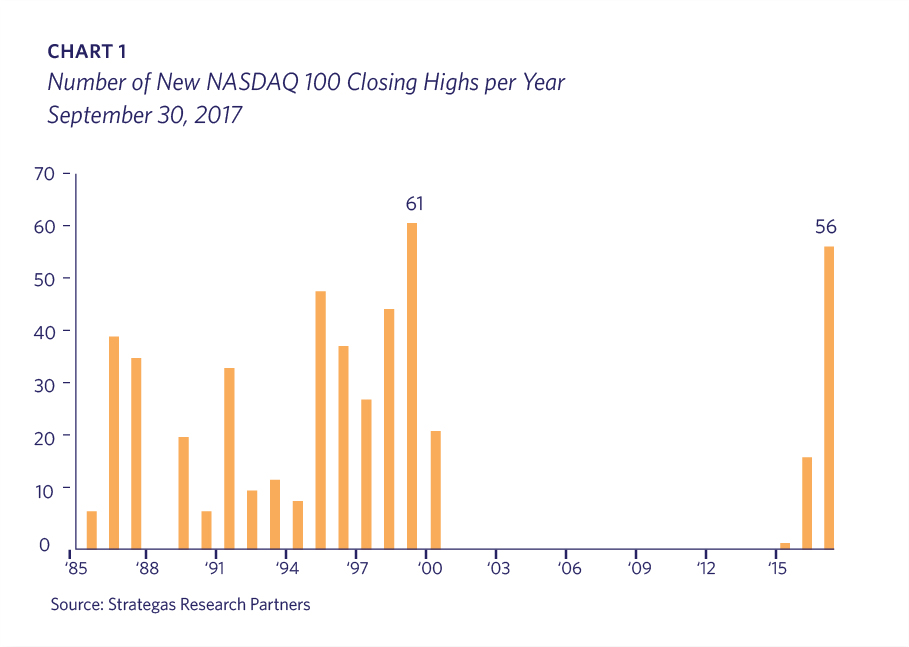
The year thus far has been marked by yet another rally in asset prices, as the majority of global investment markets continue to trend higher. The following chart (chart 1), which tracks the number of record-setting daily closes of the NASDAQ 100, indicates that 2017 will be one for the record books. The widely followed Case-Shiller U.S. National Home Price Index has now convincingly surpassed its pre-crisis highs. Despite rising short term interest rates, most fixed-income markets are standing their ground. Even commodity prices, which have been in a bear market for years, are showing signs of life. In what some pundits are pointing to as confirmation that excesses are building up, “Initial Coin Offerings” (more on this later) have attracted over $2.2 billion of capital this year. Taken together, this of course leads many observers to conclude: This must be the peak!
Everyone knows the rally in asset prices will end at some point. It’s the when that is challenging to determine. However, while market tops are never identical, they frequently share many of the same characteristics. As investment managers tasked with asset allocation and portfolio construction, Lyell Wealth is keenly interested in identifying these commonalities so we can position portfolios accordingly.
By our lights, an economic recession and its brother in arms, a bear market, do not appear imminent. Most sign posts we monitor continue to point to an economic expansion fueled by synchronized global growth, cheap money and a weaker U.S. dollar.
Credit
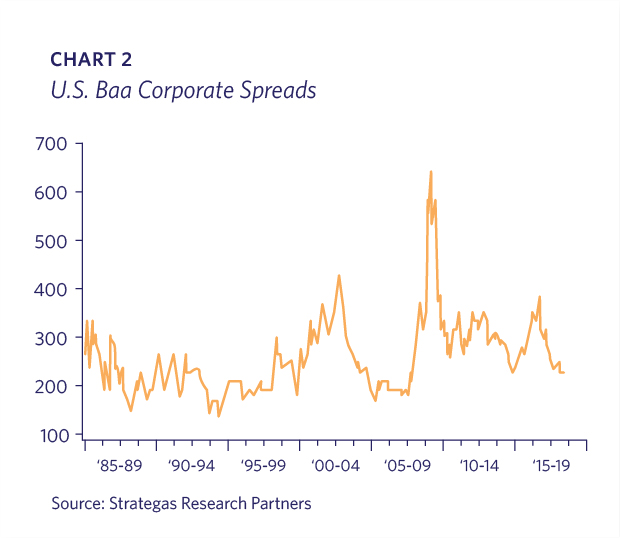
Perhaps most importantly, the high yield credit markets and credit spreads remain quiet. There were no defaults in the U.S. High Yield Index in August 2017, which is the first time this has happened in three years. In September, the junk bond default rate fell below 3% for the first time in two years. Spreads between high yield and investment grade credit remain tight, in direct contrast to previous episodes of major market volatility (chart 2). This message is bullish, as a widening of credit spreads generally indicates deteriorating economic conditions.
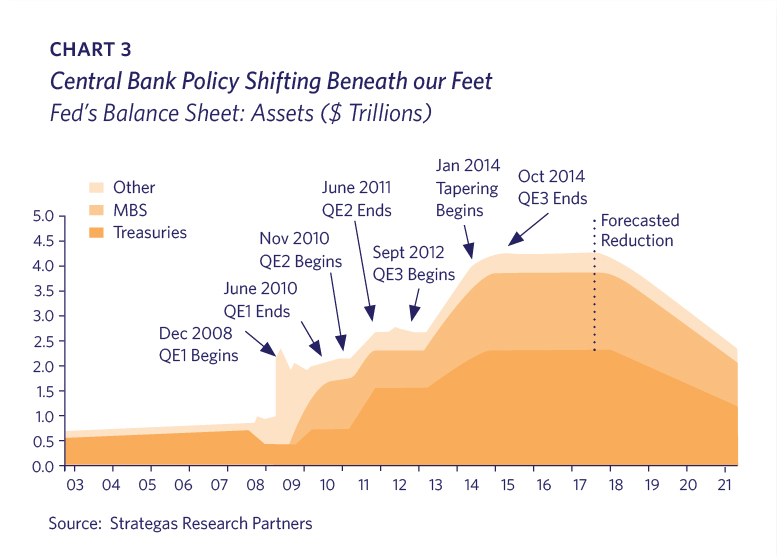
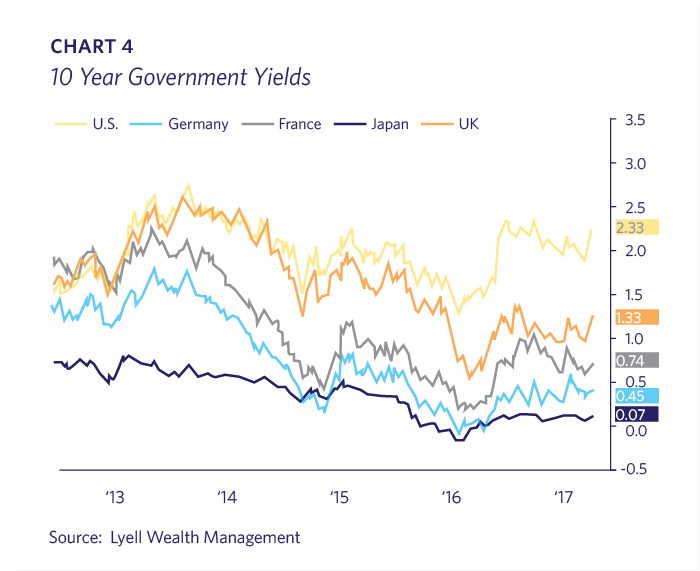
The most telegraphed event in the history of central banking, the Fed’s balance sheet run-off, is slated to begin this fall. This glacial return to more “normal” policy necessitates that the assets purchased by the Fed since the advent of Quantitative Easing in 2008 now move off the Fed’s balance sheet and back into the marketplace. Considering that the European Central Bank and the Bank of Japan are still actively engaged in Quantitative Easing, this is likely an ideal time to attempt “Quantitative Tightening” (chart 3). For years now, U.S. Treasuries have offered a significantly higher yield than most developed world alternatives (chart 4), creating a natural bid for U.S. issues. Lyell Wealth continues to focus on the central banks, and we believe a policy mistake and the corresponding impact on interest rates and credit, could be the trigger for the next recession.
Investor Sentiment
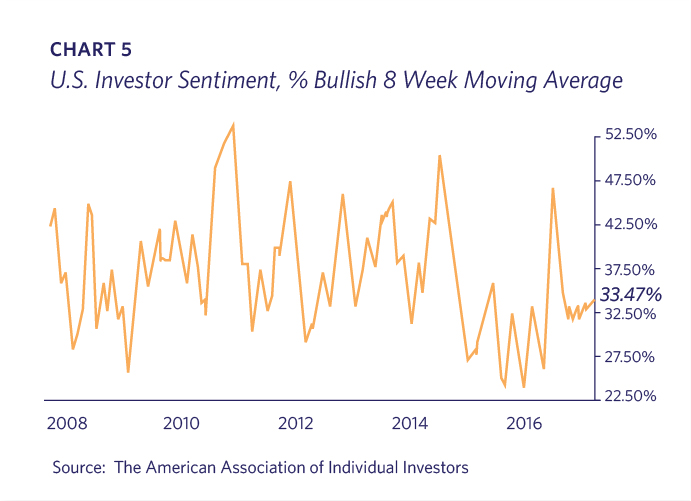
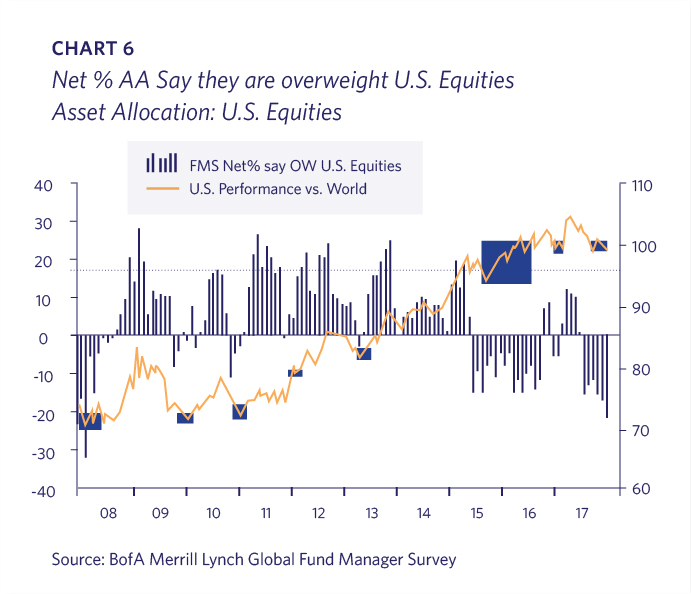
A recent survey from the American Association of Individual Investors (chart 5) shows indifference towards U.S. equities, hardly the posture one would expect at a market top. Further, the Merrill Lynch global fund manager survey (chart 6) shows a falling allocation to U.S. equities, with current readings at an underweight level not seen since the Financial Crisis. Bull markets tend to end with panic buying, not with defensive positioning and investors unwilling to embrace the lure of further price appreciation.
IPO Activity
Traditionally, a surge in IPOs has acted as a reliable signal that the market cycle was close to the end, as spiking investor enthusiasm allowed lower-quality private companies to cash out. At the moment, the IPO market is fairly quiet (chart 7). One could argue that this indicator is less relevant today, as the regulatory environment over the last decade has dampened enthusiasm for issuing stock to the public. In addition, many “unicorns” have received private financing at very generous valuations which may not be supported should those companies choose to go public.
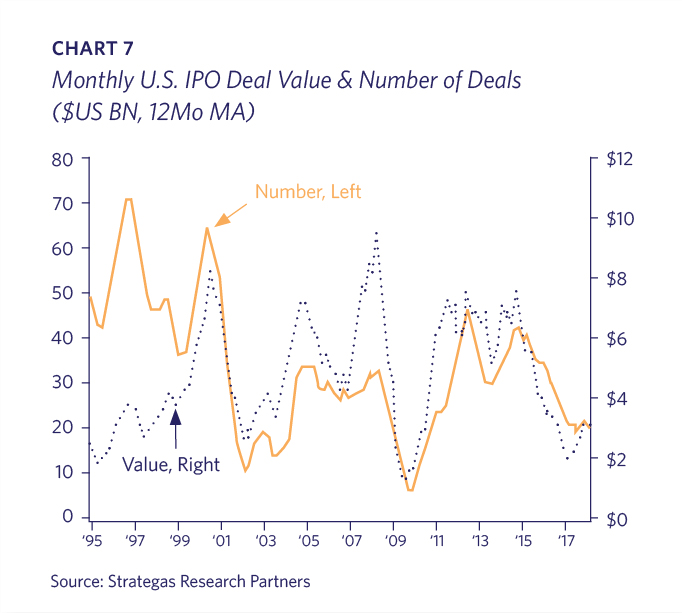
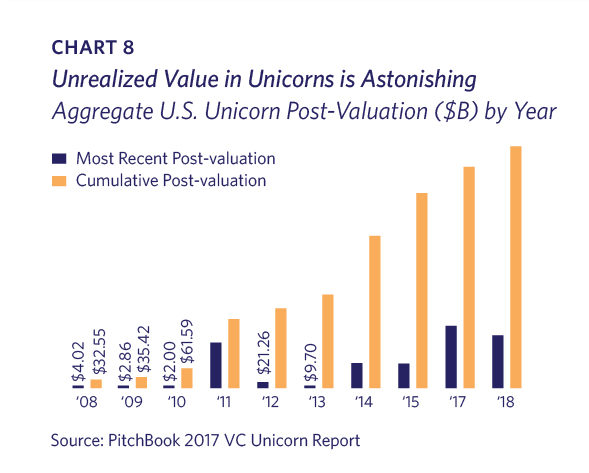
However, we did see a strong upswing in IPO activity from 2012 to 2015, suggesting that this sign post still holds some relevance. According to Pitchbook’s 2017 Unicorn Report, there is over $600 billion of unrealized value across these private companies (chart 8). Some of these gains will be realized via acquisition, but we still expect a substantial number of these companies to issue shares to the public before the cycle ends.
Earnings
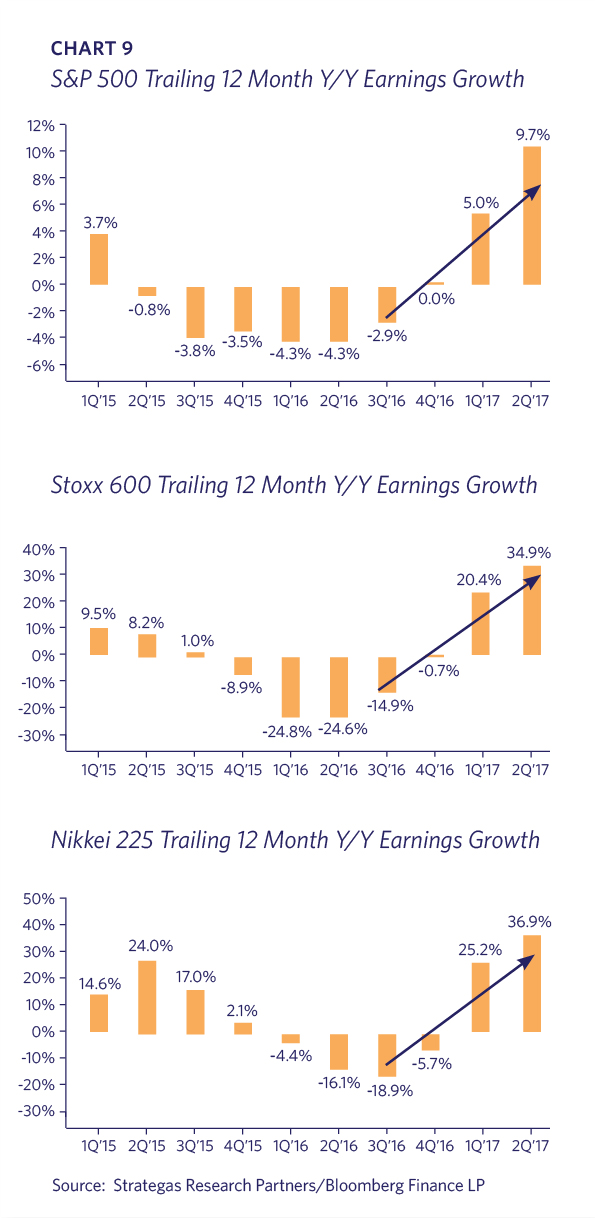
Lyell Wealth has previously written about the earnings recession which accompanied U.S. dollar strength in 2015. We’re now enjoying the benefit of a weaker U.S. dollar. This, coupled with the rebound in oil prices has generated a nice tailwind for domestic earnings, with year-over-year growth of almost 10% in the second quarter of 2017 (chart 9). This is not the earnings erosion and deceleration exhibited by a tired, waning expansion.
Price Action
August to October is a notoriously challenging period for the stock market. Right on cue, we saw out-of-favor sectors like energy and materials rally while stocks which have led this bull market moved sideways. However, defensive sectors did not exhibit any relative strength, nor did we see a pronounced narrowing of the market. On the contrary, as September came to a close we saw new highs for small caps, industrials, transports, banks and semiconductors. This broad-based strength from so many pro-cyclical sectors is an unequivocally bullish signal, strongly suggesting that we are a long way from a market top.
Stock Market Valuation
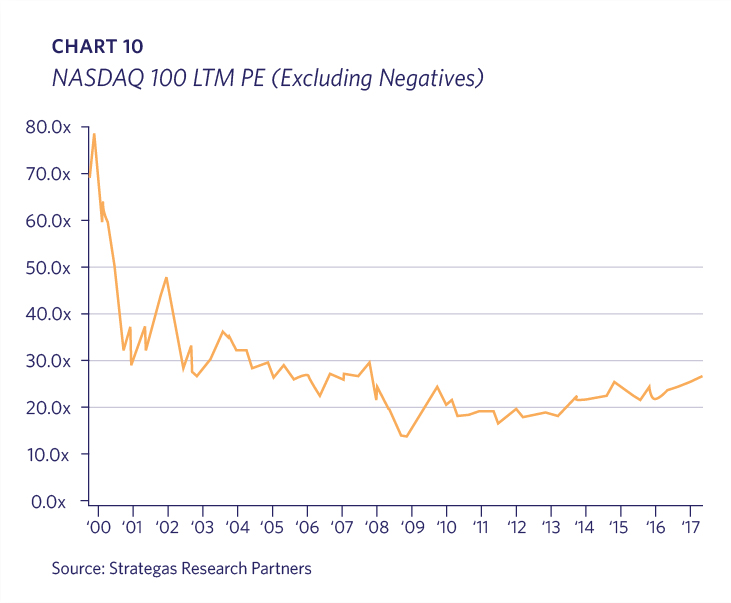
Valuation is rarely a call to action in our view, but it can be an effective thermometer to help take the temperature of Mr. Market. The market today is not cheap, but we would argue it is not expensive either. The following chart showing the valuation of technology stocks over the last 20 years indicates that, while technology companies have again led this bull market, we are nowhere near the valuations we saw during the dot-com boom (chart 10).
Bull Market Duration
While some pundits are intent on quantifying the 8+ year longevity of this bull market, it’s important to remember that 70% of publicly traded stocks corrected at least 20% from the summer of 2014 to December 2015. So perhaps this is simply a new bull market, and the use of time stamps is a misleading indicator.
Going Global
Unlike previous periods since the Great Recession, the last twelve months have been characterized by synchronized global growth. Examples include:
- Year-over-year industrial production for August increased in Japan by 5.4%, in China by 6.0%, in the Eurozone by 3.4% and in the U.S. by 1.5%.
- Year-over-year profits are up in India by 7%, in Japan by 22%, in the Eurozone by 29% and for the S&P 500 by 11%. In addition, Chinese industrial profits are up 24%.
- Various measures of consumer and business sentiment, from Europe to Asia to the U.S., are at multi-year highs.
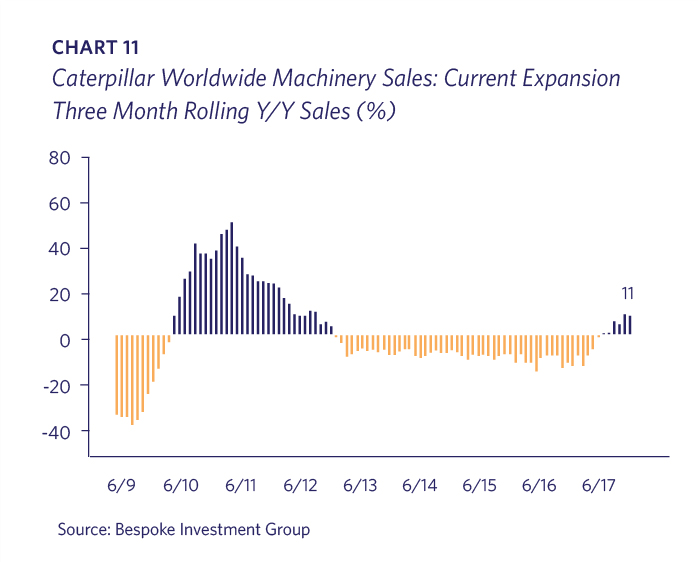
- Caterpillar, Inc. (CAT) global sales, which were negative on a year-over-year basis every month for over three years, turned positive earlier this year (chart 11). As the chart suggests, these trends tend to last for several years.
- The Baltic Dry Index, which measures pricing for goods traveling overseas and generally is a good indication of global trade, has tripled since bottoming in late 2015.
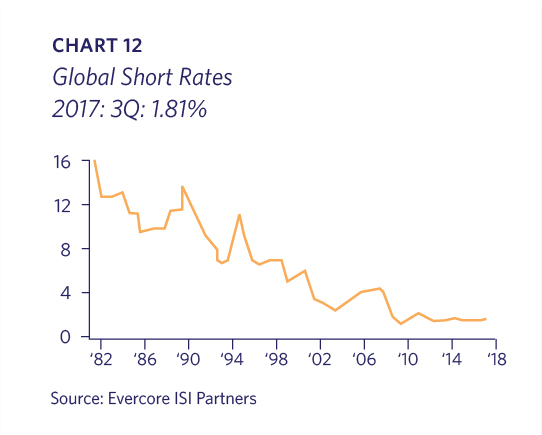
- Global short rates continue to be very stimulative, near all-time lows (chart 12).
Taken together, it is clear to us that global growth is in the best shape it has been in during this cycle.
It is reassuring that many of the signs seen at prior peaks are not yet evident. However, there are some areas in which excesses are building up, and we continue to watch these closely.
Digital Currencies
While we are not arguing for or against the merits of crypto-currencies, the price action in this new market is astounding. The New York Times had the following description of an Initial Coin Offering which is worth sharing: “If you’re having trouble picturing it: Imagine that a friend is building a casino and asks you to invest. In exchange, you get chips that can be used at the casino’s tables once it’s finished. Now imagine that the value of the chips isn’t fixed, and will instead fluctuate depending on the popularity of the casino, the number of other gamblers, and the regulatory environment for casinos. Oh, and instead of a friend, imagine it’s a stranger on the internet who might be using a fake name, who might not actually know how to build a casino, and whom you probably can’t sue for fraud if he steals your money and uses it to buy a Porsche instead. That’s an I.C.O.”
The total U.S. dollar value of the top 25 crypto-currencies was over $115 billion as of September 21st, 2017. While we believe digital currencies and distributed ledgers (block-chains) may solve many issues associated with the current system, we’re skeptical of the “valuation” of these new distributed networks. At the present time, this fledgling market remains much too small to impact the overall economy or markets; we continue to follow this evolving technology closely, however, as the potential economic impact of these networks could be profound.
Excess Liquidity Driven by Central Bank Policies
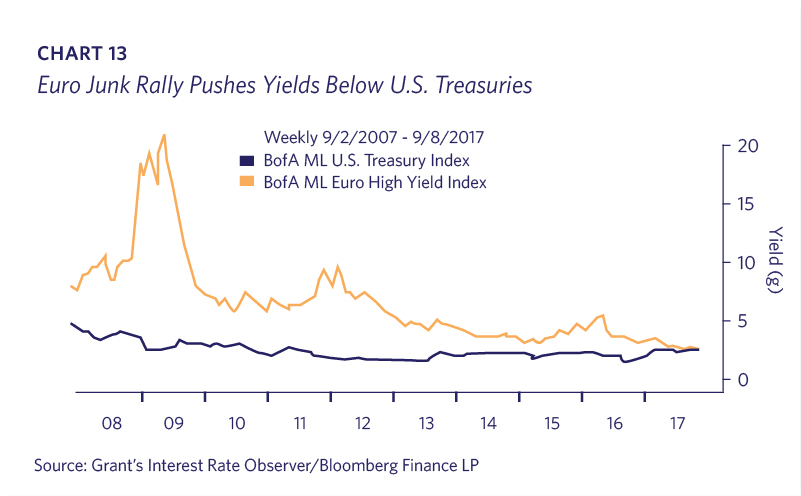
Thanks to negative deposit rates and years of quantitative easing, startling messages are coming from overseas fixed income markets. In late August, Italy borrowed 2 billion euros for two years at a negative 0.139%. Said differently, borrowers paid Italy, the 2nd most indebted Euro country, to take their money. For those interested in obtaining a positive yield, Austria happily sold 3.5 billion euros in one-hundred year bonds for a 2.1% yield; it is alarming that a 1% increase in interest rates would reduce the face value of the Austrian bonds by 30%! This insatiable demand for European credit is not confined to the government sector. Yields on the BofA ML Europe High Yield Index have recently dropped below those of the BofA ML U.S. Treasury Index (chart 13). The fixed income environment in Japan is similarly unusual.
Unfortunately, speculative lending behavior is not only confined to overseas. Volume for leveraged loans, a favored capital source used by private equity firms for buyouts, is up 53% in the U.S. in 2017, and is set to surpass the previous record set in 2007. This is not surprising given the rise in asset prices. Grant’s Interest Rate Observer recently commented that “protections have gotten so lax in the $1 trillion market for U.S. leveraged loans, that if an offering comes with decent covenants (to protect creditors in the event of a default) lenders take it as a sign something is wrong with the deal.” This is a good example of what happens towards the end of credit cycles.
Unlike crypto-currencies, the global fixed income markets most definitely matter to the economy and stock markets. How successfully the central banks unwind their unprecedented balance sheet expansion is critically important. They are at the beginning stages of telegraphing how they will reduce their bond holdings. How interest rates will react to these moves is unknown. In particular, European and Japanese banks, insurance companies and pension funds are laden with huge amounts of low or negative-yielding bonds; per the potential loss as profiled in the Austria situation, the risks are high.
Takeaways
An aging bull market, the memory of two major crashes in the last 17 years, increasing geopolitical tensions, and signs of building financial excesses have many investors and clients nervous. We understand these concerns, as we find them worrisome as well. However, while we do see a few areas of froth in the foreign fixed income markets, the fact remains that most of the data points we are monitoring continue to suggest that the economic expansion and bull market remain intact. In fact, given the dysfunction in Washington D.C., the market is just now beginning to contemplate tax reform and other pro-growth initiatives. Should these policy changes materialize, it’s likely they will extend the rally even further.
All that said, Meg McConnell of the New York Fed aptly described the reality of panics: “We spend a lot of time looking for systemic risk; in truth, however, it tends to find us.” As much time as we devote to trying to decipher where we are in the economic cycle, we are fully cognizant that surprises can and will happen. Given the recent rhetoric surrounding North Korea, one can imagine how things could take a turn for the worse. For this reason, Lyell Wealth continues to believe strongly in maintaining a diversified investment portfolio; one that can weather the unexpected and reflects each individual client’s objectives and temperament.